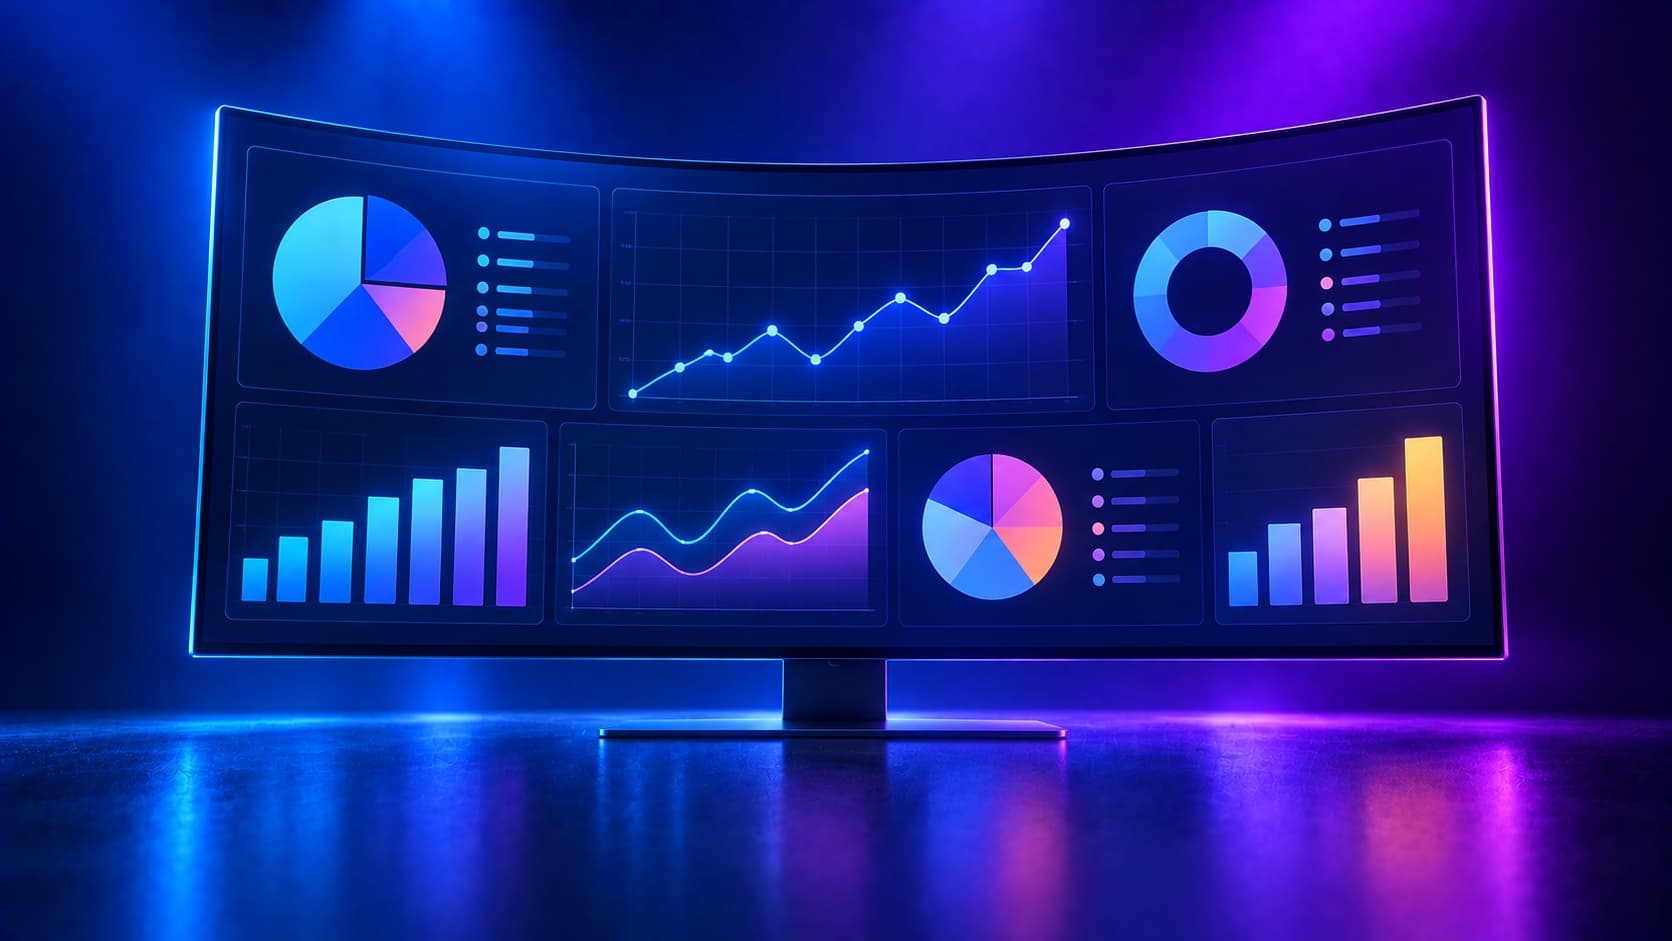
Looker Studio live dashboard: Sheet, Facebook Ads and GA numbers on one page, updating by themselves
About this service
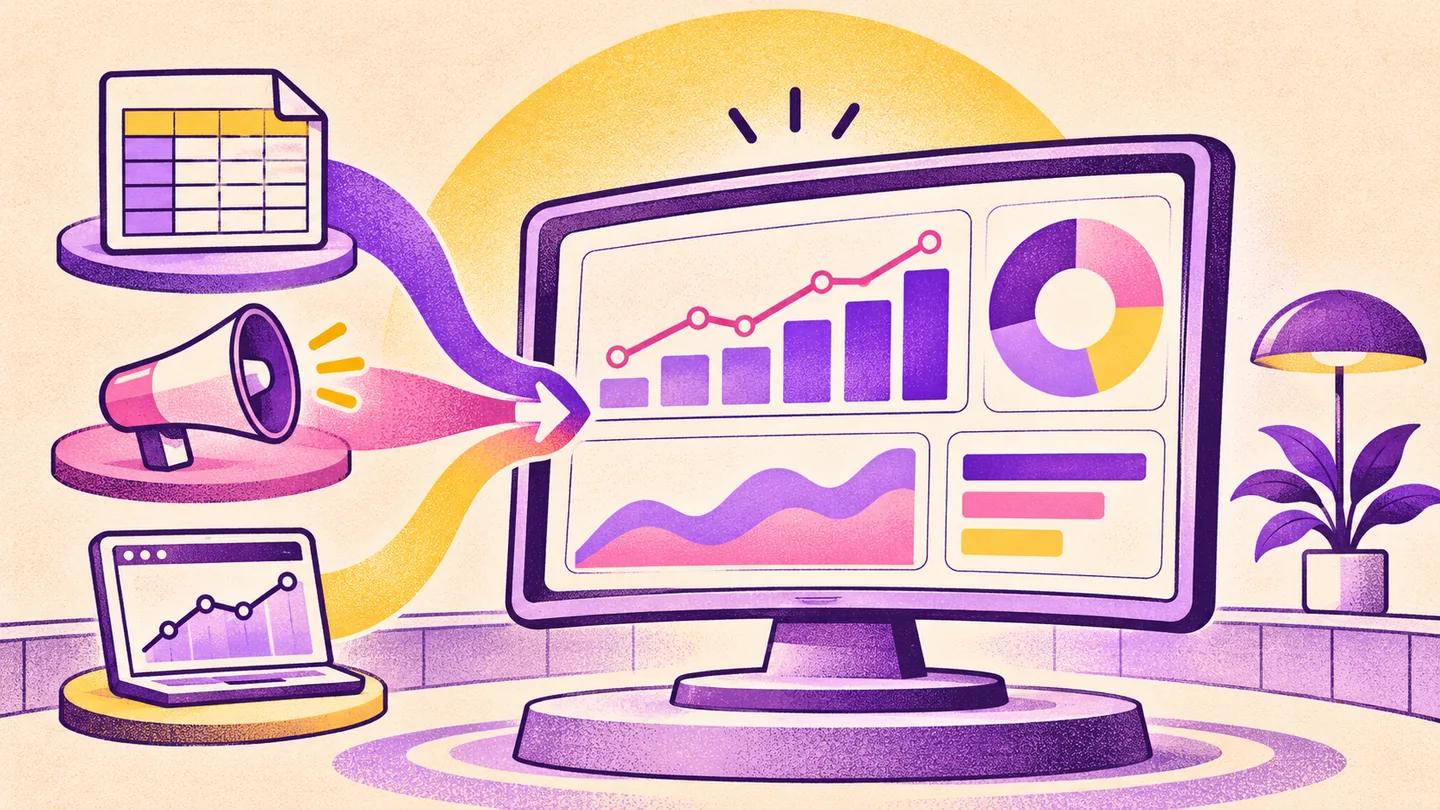
Numbers from Google Sheets, Facebook Ads and Google Analytics on one Looker Studio dashboard page. It updates by itself, so you do not have to build the report by hand every week. The same job every Monday: copy the spend from Ads Manager, visitors from Analytics, sales from the order sheet, then join them in Excel and send them to the boss or client. The numbers are out of date before the report arrives, and next week nobody remembers how the calculation was done. Looker Studio (formerly Google Data Studio) is Google's free tool, and it connects directly to these sources. Once it is built properly, you do not have to build the report again. You just open the link. ◆ What I do First we find out which five or seven questions the dashboard must answer: how much ad spend went into each order this month, which campaign is bringing leads, which product is not moving. Then I connect the sources inside your own Google account, build the needed calculations, lay out the charts, add filters by date and campaign, and hand over only after matching it against the real numbers at the source. These are the same steps we teach in Learning Bangladesh's "Data Visualization With Looker Studio" course. That course was published in 2020, when the tool was still called Google Data Studio. ◆ Three packages One: a one-page dashboard from one source, for example only a sales sheet or only GA. Three: three pages from three sources: summary, ads, sales or leads, plus a PDF emailed automatically every week. Full: up to five sources, a target-versus-actual page for management, and an n8n pipeline that pulls Facebook Ads data into a sheet every day. ◆ Who it is for Businesses that sell by running ads on Facebook, agencies that have to report to clients every month, NGO project teams that have to show donors regular numbers, and managers who lose one day a week to stitching reports together. If your data is in a single Excel file and does not change daily, this is not for you. Take our "Excel dashboard" gig instead, which opens even without the internet. ◆ What needs to be said honestly Live does not mean every second. Numbers from a sheet usually arrive within about fifteen minutes, and GA and ads numbers a few hours later. Facebook Ads is not in Google's own connectors, so it has to come either through a paid connector in your name or by way of a sheet. The "Purchase" Facebook shows and your real orders will not match exactly, because the two count by different rules. We do not hide the difference, and the source is written next to every number. And a dashboard shows numbers, it does not make decisions. This work makes no promise of higher sales. ◆ How it goes After you order, I show you the list of questions and a one-page draft of which chart goes on which page. I start building only after you approve. I need access through roles, never passwords. At handover, on a screen share, I switch each source's permission to your own account, so the charts do not go blank even if our access is removed, and I show you where to change dates or add a new chart.